2.8. Exemple numérique: MC avec variable de contrôle#
On considère le calcul de \(I = \mathbf{E} \Big[\cos\big(\frac{\pi}{2} U\big) \Big]\) où \(U \sim \mathcal{U}(]0,1[)\).
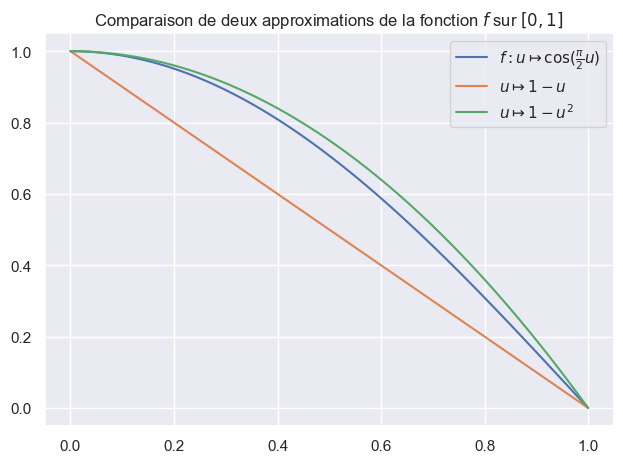
On commence par tracer la fonction \(f\) sur \([0,1]\), ainsi que 2 approximations naturelles, la fonction linéaire \(u \mapsto 1-u\) et la fonction quadratique \(u \mapsto 1-u^2\) qui valent toutes les deux 1 en \(u=0\) et 0 en \(u=1\).
from math import pi
def f(u):
    return np.cos(0.5*pi*u)
uu = np.linspace(0, 1, 1000)

fig, ax = plt.subplots(layout='tight')
ax.plot(uu, f(uu), label=r"$f:u \mapsto \cos(\frac{\pi}{2} u)$")
ax.plot(uu, 1-uu, label=r"$u \mapsto 1-u$")
ax.plot(uu, 1-uu*uu, label=r"$u \mapsto 1-u^2$")
ax.set_title(r"Comparaison de deux approximations de la fonction $f$ sur $[0,1]$")
ax.legend()
plt.show()

On suppose que l’on connait \(\mathbf{E}[U] = \frac{1}{2}\) et \(\mathbf{E}[U^2] = \frac{1}{3}\). De sorte que \(\mathbf{E}[1-U] = \frac{1}{2}\) et \(\mathbf{E}[1-U^2] = \frac{2}{3}\).
Ces approximations suggèrent d’utiliser et de comparer les variables de contrôles (recentrées) suivantes:
On a donc deux représentations de \(I\)
où \(U \sim \mathcal{U}(]0,1[)\), ce qui conduit à deux estimateurs différents
où \((U_k)_{k \ge 1}\) suite i.i.d. uniforme sur \(]0,1[\).
Show code cell source
from scipy import stats

def monte_carlo(sample, proba = 0.95):
    """
    Computes the mean, variance, and a confidence interval (CI) of a
    given sample data set using the Monte Carlo method.
    Parameters:
    -----------
    sample : array-like
        The data set to be analyzed
    proba : float, optional
        The probability that the true mean of the population is
        within the calculated interval. Default is 0.95
    Returns:
    --------
    dict of { 'mean': float, 'var': float, 'lower': float, 'upper': float }
        The mean, variance, lower bound of the CI and upper bound of the CI
    """
    mean = np.mean(sample)
    var = np.var(sample, ddof=1)
    alpha = 1 - proba
    quantile = stats.norm.ppf(1 - alpha/2)  # fonction quantile
    ci_size = quantile * np.sqrt(var / sample.size)
    result = { 'mean': mean, 'var': var,
               'lower': mean - ci_size,
               'upper': mean + ci_size }
    return result
n = int(1e5)
sample_U = rng.random(size=n)
sample_mc = f(sample_U)
sample_vc1 = f(sample_U) - (0.5 - sample_U)
sample_vc2 = f(sample_U) - (1./3. - sample_U**2)
result = pd.DataFrame([
    monte_carlo(sample) for sample in [sample_mc, sample_vc1, sample_vc2] ],
    index = ["MC", "VC1", "VC2"])
result
| mean | var | lower | upper | |
|---|---|---|---|---|
| MC | 0.635631 | 0.095005 | 0.633720 | 0.637541 |
| VC1 | 0.636311 | 0.004104 | 0.635914 | 0.636708 |
| VC2 | 0.636613 | 0.000383 | 0.636492 | 0.636734 |
ratio_1 = result["var"]["MC"] / result["var"]["VC1"]
ratio_2 = result["var"]["MC"] / result["var"]["VC2"]
print("Le ratio de variance par la première variable de contrôle:", ratio_1)
print("Le ratio de variance par la seconde variable de contrôle:", ratio_2)
Le ratio de variance par la première variable de contrôle: 23.149825042475708
Le ratio de variance par la seconde variable de contrôle: 248.28251012181374
